Geospatial Dashboards Bring the ‘Where’ and So Much More to Your Screen
By Randy Claar, GISP, and Justin Mugnai
How handy is a tool that puts a snapshot of your data at your fingertips, places key information on a single screen, and enables communication with upper management and clients? Dashboards can do these things and so much more.
According to Wikipedia, a dashboard is a type of graphical user interface which often provides at-a-glance views of key performance indicators (KPIs) relevant to a particular objective or business process. Google calls dashboards a collection of widgets that give you an overview of the reports and metrics you care about most. Rooted in ‘The Science of Where’, Esri defines a dashboard as a view of geographic information that helps you monitor events or activities, offering a comprehensive and engaging view of your data to provide key insight for at-a-glance decision making.
All of these provide insight into dashboards and their ability to quickly present a coordinated, multi-panel snapshot of relevant data.
Dashboards serve different purposes for organizations. Some are operational while others are more strategic. Some can be analytical or just informative.
There are many reasons to have a dashboard including:
- See multiple data elements presented together on a single screen
- Monitor key metrics
- Use as a reporting tool
- Create customized views of larger data sets
Sewall uses the Esri ArcGIS platform to create dashboards for many of its projects. In delivering our services, these dashboards complement our other applications and perform a vital role in our overall communications plan. The panels in our dashboards are generally some combination of maps, calendars tables, charts, and graphs and present information in a coordinated manner for the intended audience. Some dashboards have multiple layers allowing a user to drill down into a particular item.
The first example dashboard is from a field verification project. For these types of projects, the dashboard serves more than one purpose and is intended for multiple audiences. Displaying in a web browser the dashboard communicates project items internally to project staff up through senior management, as well as externally to client personnel. The dashboard is implemented along with our Mobile Verify https://sewall.com/project/mobile-verify/ field application and a data hosting center, forming a comprehensive platform on which to deliver this service.
The dashboard’s panels support project planning, tracking, and reporting. On the first screen, panels provide the viewer with an overview, ranging from the project’s status and timeline to a map showing the multiple locations where field crews are being deployed.
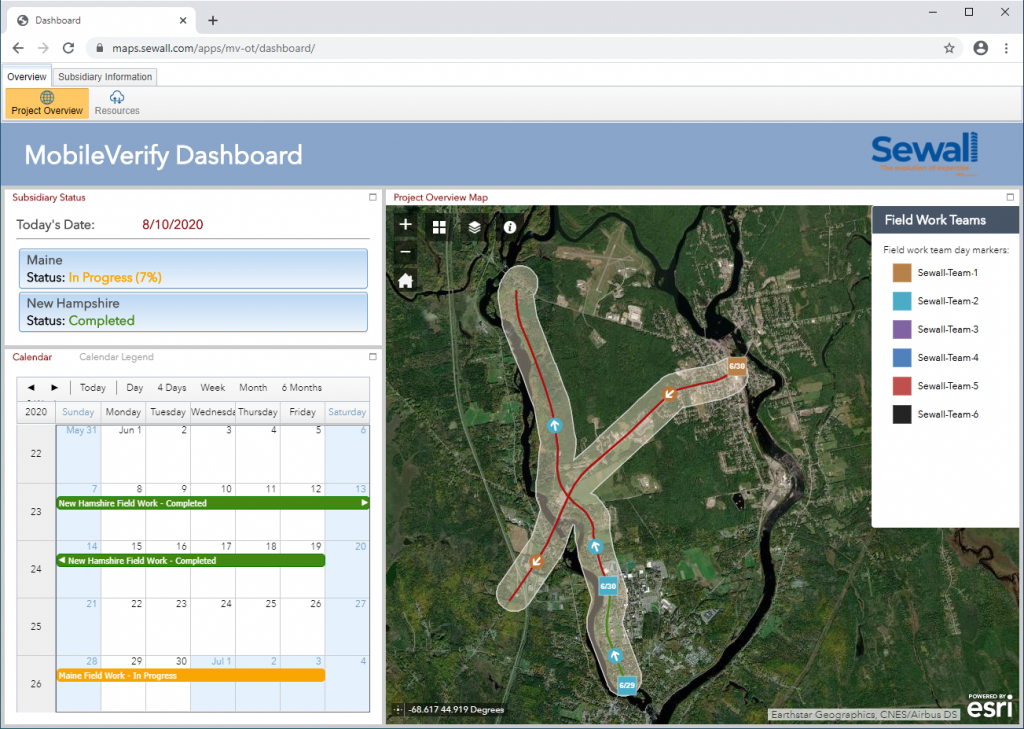
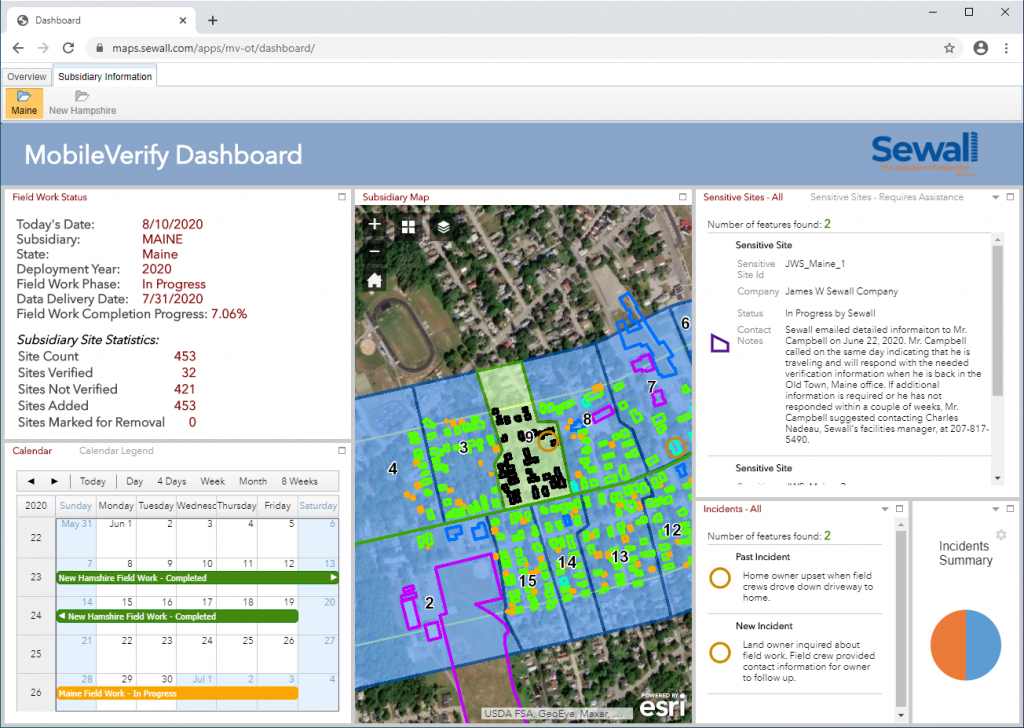
When a user selects to view one of the individual project areas, the panels change to present information in more detail about the particular area. The tailored panels include a listing of statistics for the area, a map showing the routes to be traversed by each field crew, a calendar with the fieldwork schedule, and tabular data relevant to the fieldwork.
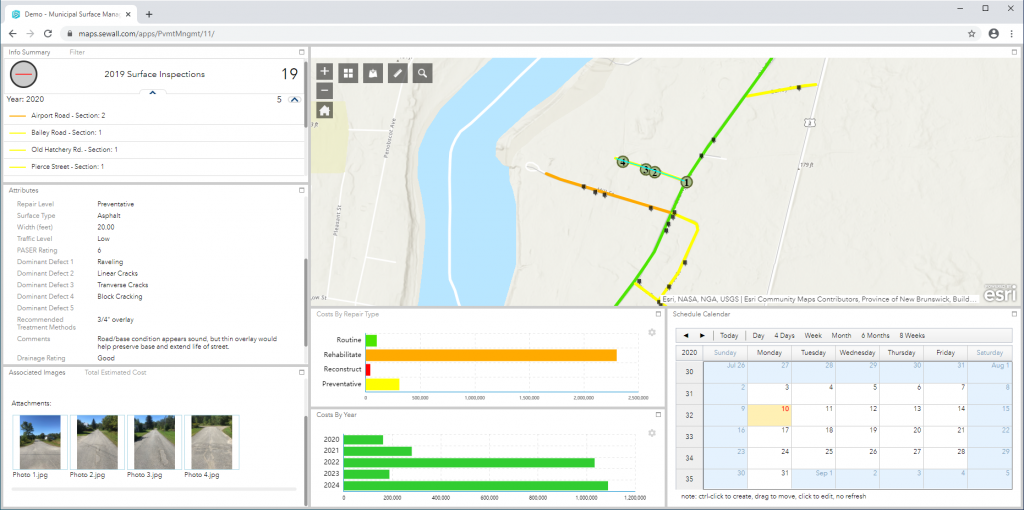
A second example of a dashboard is the Municipal Roadway Management™ which is part of our road management solution. With a diverse staff of traffic, civil, and structural engineers, surveyors, and geospatial analysts and with over two decades of on-site infrastructure evaluation experience of over 750 public and private facilities, Sewall offers an expansive and diverse package of road management solutions to municipalities. In this solution the web browser displays dashboard panels that provide the user road inspection data, data filters, interactive charts, an event calendar, a map displaying inspection lines symbolized by recommended repair type, a gallery of supporting inspection photographs, as well as road maintenance planning and budgetary items.
Geospatial dashboards are effective tools for informing audiences, helping make decisions, visualizing trends, and monitoring status. Integrated with other geospatial components such as data, maps, and applications, dashboards are an essential part of an organization’s overall geospatial infrastructure. Dashboards save time and money and are the perfect solution to deliver a complete picture of your location-based information.